備忘録#1
若いころより覚えが悪くなってきた。コードも以前のようにスラスラ書けない。というわけで、Rで全長などの分布を調べるコードを備忘録として残しておいてみる。
rm(list=ls())
library(dplyr)
library(ggplot2)
library(tidyverse)
library(ggpmisc)
kawabata<-read.csv(“D:\\03R\\02_カワバタモロコ全長体重調査.csv”)
ggplot(data=kawabata)+
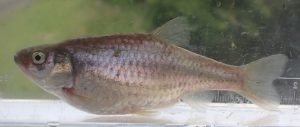
labs(title=”Hemigrammocypris rasborella Length”)+
theme(plot.title=element_text(face=”italic”))+
geom_boxplot(aes(x=date2,y=length),width=0.2)+
facet_wrap(~St+Trap.posi.)+
coord_flip()
ggplot(data=kawabata)+
labs(title=”Hemigrammocypris rasborella”)+
theme(plot.title=element_text(face=”italic”))+
geom_histogram(aes(x=length),binwidth=2)+
facet_wrap(~St+date2)
kawabataN<-subset(kawabata, weight!=”N”)
kawabataN$weight<-as.numeric(kawabataN$weight)
kawabataN$length<-as.numeric(kawabataN$length)
ggplot(kawabataN,aes(x=length,y=weight, colour=sex))+
geom_point()+
geom_smooth(method=”lm”)+
facet_wrap(~St+Trap.posi.+date1)